

Lab Plot n Fit v17.4 – A software for fitting and plotting data and performing statistical analysis
To use this software, you need to have version 3.99 or higher installed on your system
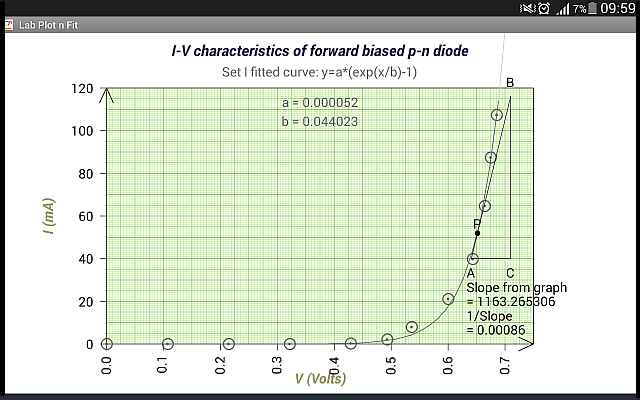
This software allows you to create various types of graphs and perform statistical analyses on your data in a simple and user-friendly environment. It can be used to analyze and visualize data from different fields such as physics, chemistry, and biology, as well as for engineering applications. The software is designed to help you easily create graphs and perform calculations using various statistical methods. It offers a wide range of features and tools to assist you in your data analysis tasks. Lab Plot n Fit is a powerful tool that can help you with your data analysis needs, whether you are a student, researcher, or professional. It provides you with the necessary tools to analyze your data effectively and efficiently.
The following features are included in Lab Plot n Fit:
- Interactive graphing capabilities for visualizing your data in real-time
- Comprehensive statistical analysis tools for performing various calculations and tests
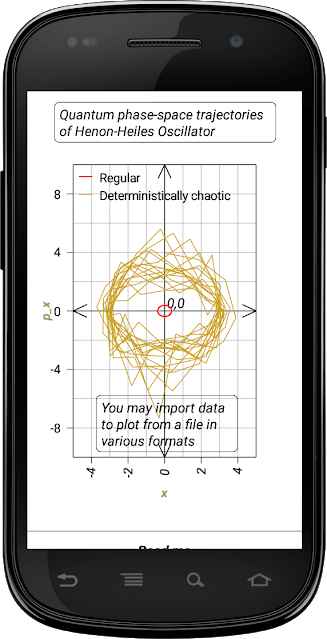
- Support for importing data in formats such as csv, txt, and dat
- Ability to export your results in various formats for further analysis or reporting
- User-friendly interface that simplifies the process of data analysis and visualization
The Lab Plot n Fit software is designed to be easy to use and provides a comprehensive set of tools for data analysis and visualization. It is suitable for both beginners and advanced users who need to analyze data quickly and efficiently. The software is compatible with version 3.99 or higher and is regularly updated to ensure it meets the needs of its users. You can download the latest version from this link for free. Enjoy using Lab Plot n Fit!

-
Version changes 17.4
- More helpful instructions on how to properly select date / time formats for time-series data incorporated.
- An obtrusive ad removed.
- Bug fixes.


Rules for sending comments
ClosePost a comment
Related
0